Web App Development
What are you Breathing?
Achieved the Industry Awards 2021 Shortlist
For my final university project, we designed an empathetic air pollution simulation that aims to bring an acute awareness to individuals about how both outdoor and indoor air pollution pervades every aspect of our lives.
Product Outline
Conceptualise, design and ultimately create a high-fidelity prototype of a web application that can be used to inform the general public around any specific problems triggered by climate change
Timeframe
12 weeks
Team Member
Savvena Christoforou
"Misinformation is becoming a massive problem on the internet, and is dividing societies on imporant issues"
My Responsibilities
Aside from shared responsibilities such as documentation and project management, here are some areas which I was specifically in charge of:
Market and User Research
Compiled several reviews from potential app competitors, analysing customer needs and common pain points
Ideation and Prototyping
Personally conceptualized the idea, and created early interactable prototypes to convey concept to team members and tutors
Mockup and Media Creation
Created all presentation media, such as promotional videos and mockups for our design, showcasing its features and innovation
Final Product
A promotional video showcasing our webapp's functionality
Design Process

1. Discover
To understand the issue at hand, thorough research into the public's perception of air pollution was required. We conducted background research, questionnaires and ethnographic studies.
All insights were collated onto an affinity diagram and analysed.
Ethnographic studies conducted on 4 apps
2 questionnaires with 28 responses
Several articles & papers reviewed
2. Define
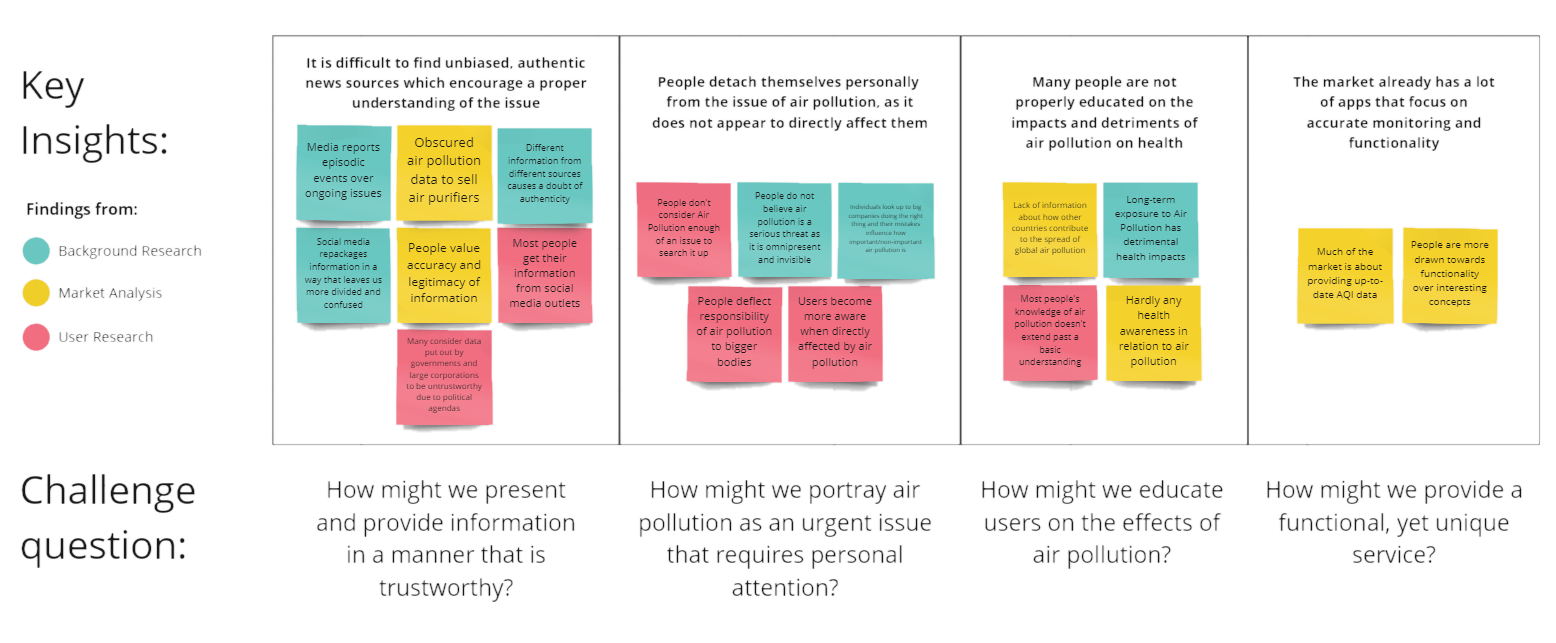
All data from our research were collated into their own respective affinity diagrams, then further synthesised into the diagram below, allowing us to draw four key insights from our research. In order to better frame these insights, we applied the how-might-we framework, turning them into questions which could be used during our ideation phase
3. Develop
Early Iterations
To have a better grasp on the direction we wanted to go in for our project, my partner and I each generated a few sketches and early iterations. We experimented with a few ideas before honing in on our final concept. Our first thoughts on the initial concepts was that Concept 1 was too shallow in it's functionality, whilst Concept 2 would be quite hard to build. To resolve this, we reimagined Concept 2 to be a contained simulation as opposed to a reactive environment, allowing us to rationally plan out our product's development within the 12 weeks allocated.

Concept 1 was a snapchat filter in which users could have the ability to visualise the air pollution around them, and send photos with these applied filters to spread awareness. Additionally, users would be able to view particular pollutants in the air and trace their sources.
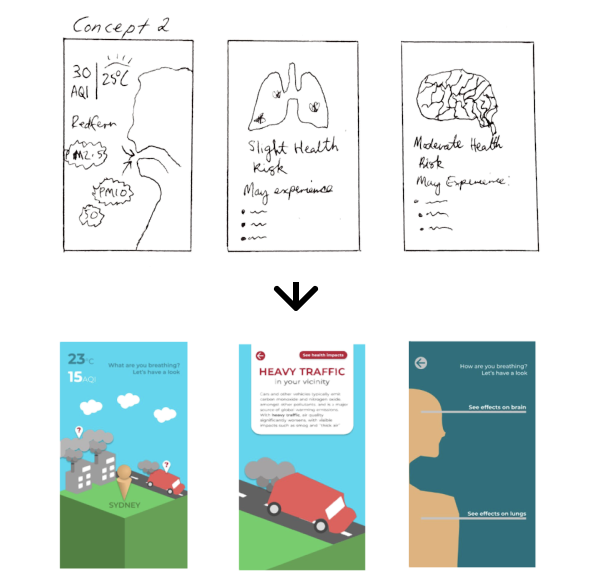
Concept 2 was a live air pollution source tracker, which would portray a dynamic environment that would change depending on the user's location and air pollution sources near them. Users would be able to pin-point these sources and gain awareness from them.
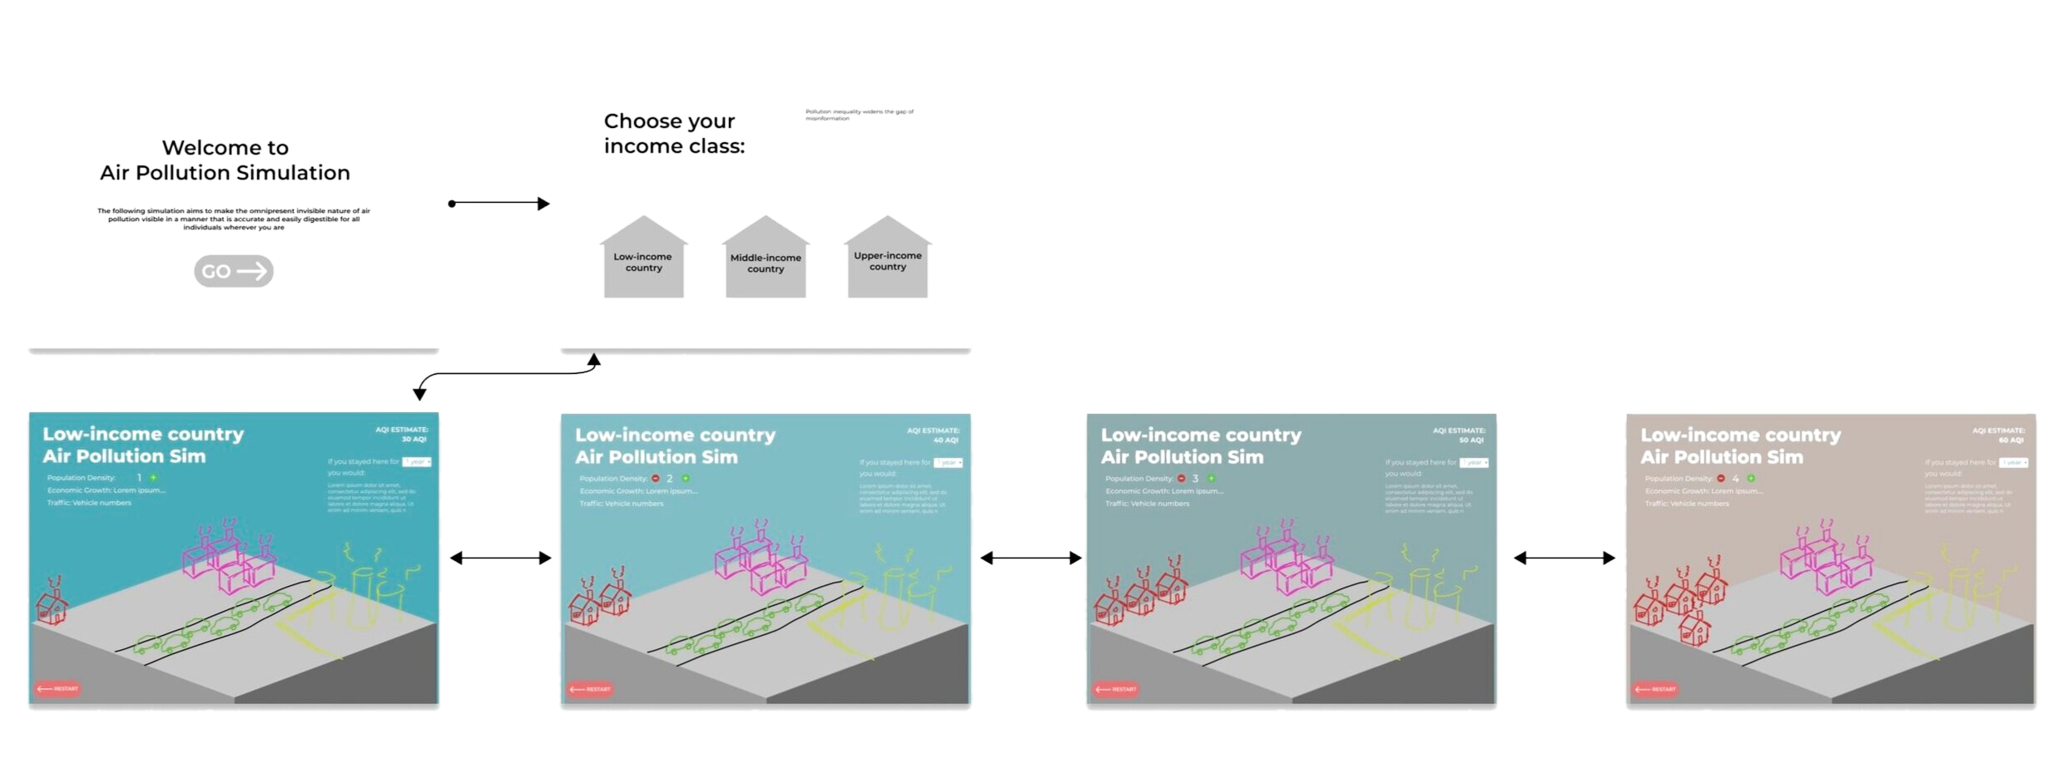
Iteration 1
Once we had a good idea of the kind of project we wanted to pursue, we moved to making properly interactable prototypes on Figma, which allowed us to conduct user testing and rapid prototyping.
We also decided to build our platform on Unity at this point, so I focused on functionality over aesthetics, as they would be highly dependant on model packs provided in Unity.
User testing methods and results are shown further down
Very early prototypes were rough and sketchy. We focused more on getting all the functions on the table first, then building upon the aesthetic later
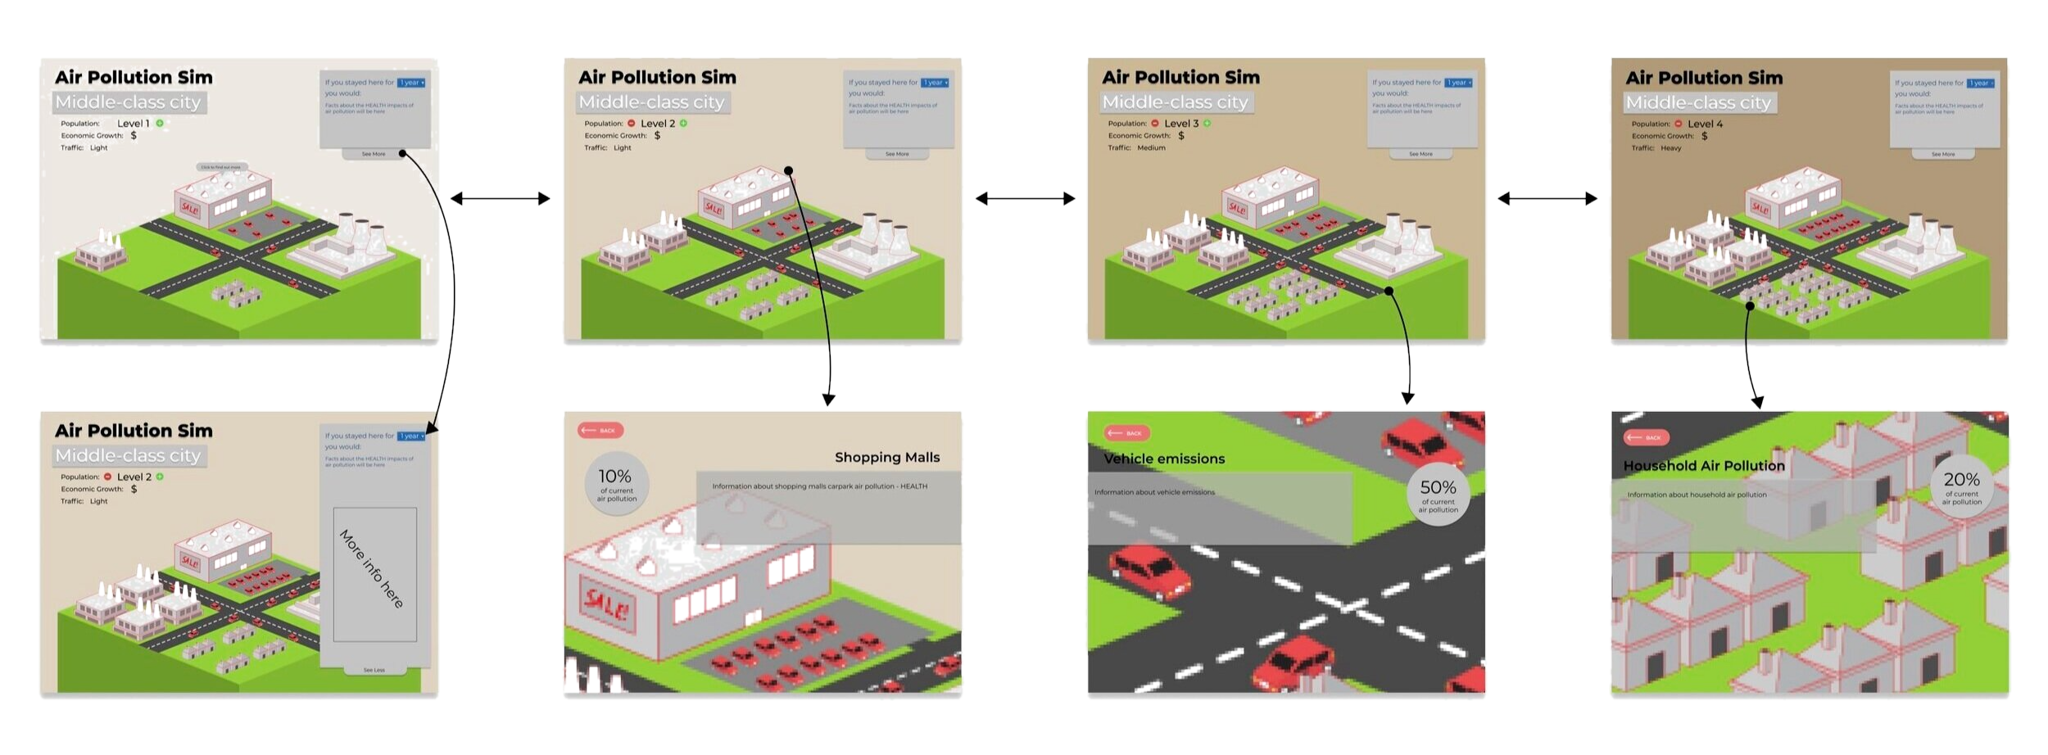
Iteration 2
Focus on creating a basic experience that could be built off of
Iteration 3
Steady refinement on asset aesthetics to allow for a less jarring user experience during testing. Functionality expanded upon.
Iteration 4
Implementing changes based on feedback, which included making information more accessible (less clicking to reach)

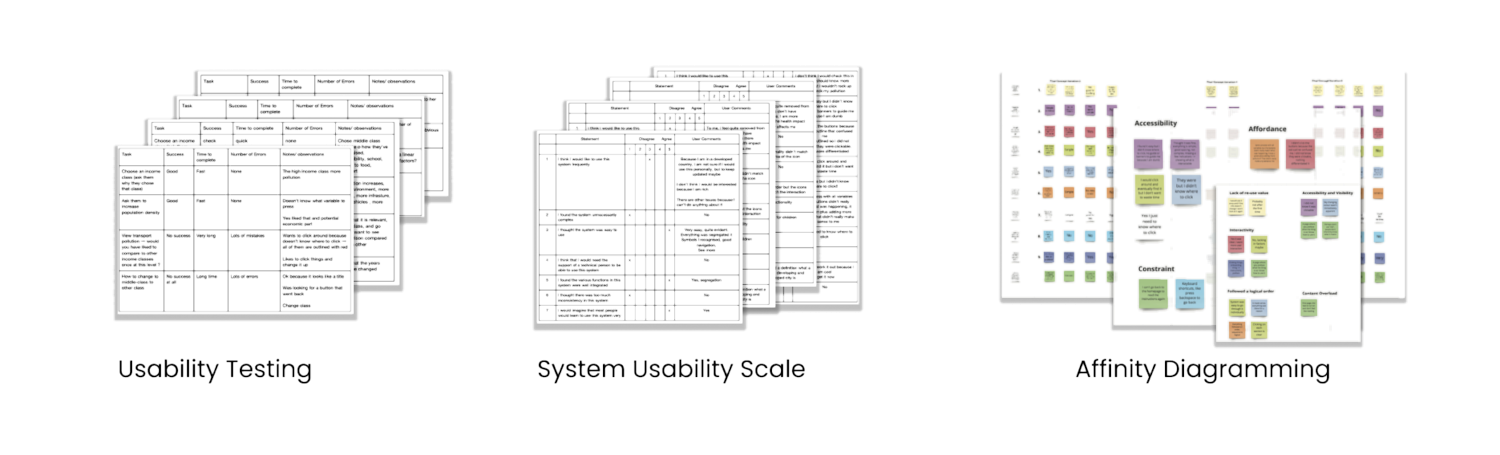
User Testing
Between each iteration, we ran 5 user tests with distinct people, conducting usability testing with the think-aloud method and system usability scale, then collated our insights onto an affinity diagram to implement productive changes.
Findings
Affordances
Users occasionally missed certain functions as they weren't clear enough. This was refined upon in the final iterations
Accessibility
Users found the web application straightforward and simple to use. The simple structure was maintained through iterations.
Visibility & Hierarchy
All participants noticed that the button controls and information served as constant reminders for their city type and population, reducing kinetic load and making the experience more intuitive
4. Deliver
Once the prototyping and iteration phase was complete, we began to build our concept on Unity, whilst continuing user testing. My partner was in charge of coding, and I managed the scene creation, and as we were both new to using Unity, we learned more about the platform as we built our product, becoming more aware of its limits. We began to make more conscious design decisions, and refined elements of the interface such as the buttons and the logo.


Final Product

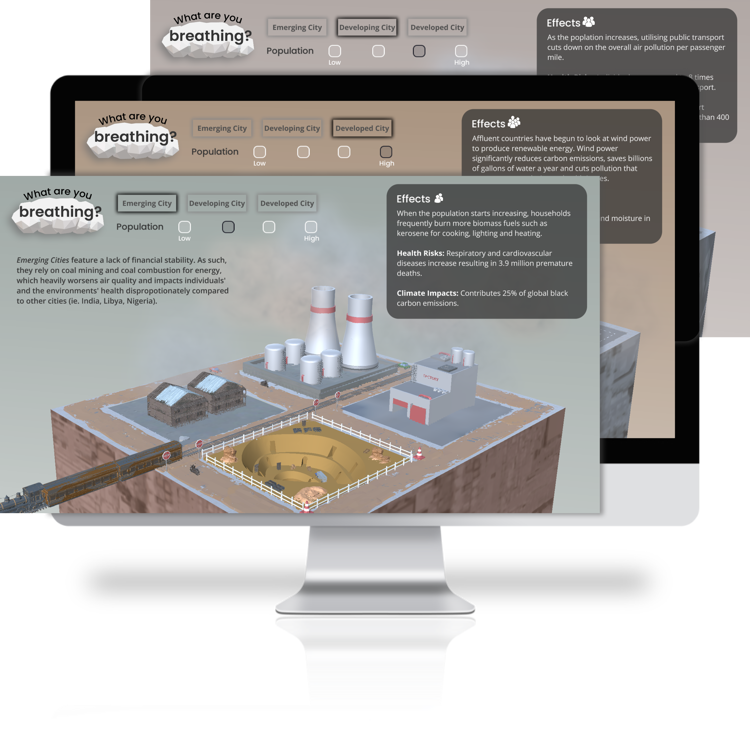
Main Functionality
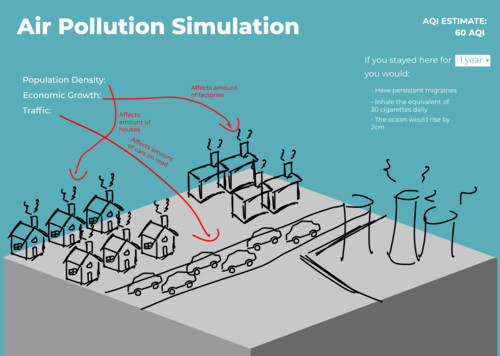
Interactive Environment
Allows users to see how different factors can affect air pollution rates in different settings
Educational Content
Provides information for each factor combination, highlighting sources and health risks
Confronting Imagery
Uses qualitative imagery over quantitative statistics

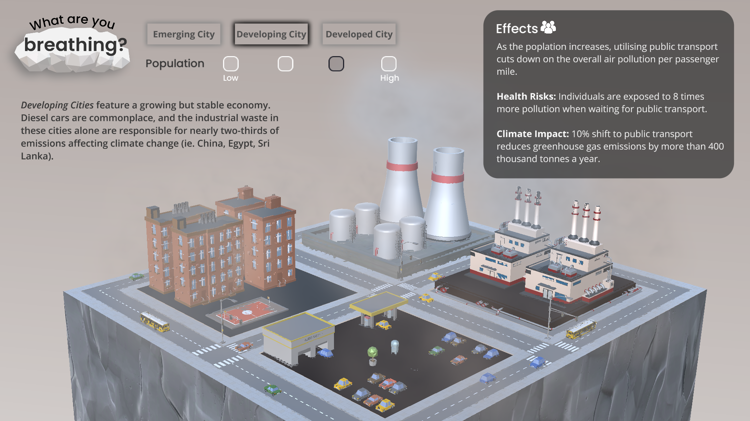

Final Screens

Project Reflections
Impact
During our final testing stages, we received a lot of positive feedback from our users. Here are a few quotes recorded from our sessions:
Comparing Settings
“I didn’t know that other countries affected another country’s air quality, the graphics helped me understand that”
“Without reading the text I can tell that the website is about how air pollution increases when populations increase by comparing it to other cities”
Emotional Response
“It makes me kind of sad when I see the air pollution because the world isn’t doing anything about it”
“I did not know there was disproportionate air pollution across the world, it makes me upset and I feel lucky”
Emotional Response
"It's about climate change and it has impacted my perspective on air pollution... I am more aware of how it can affect climate change and what cities globally should be doing"
Challenges
End-to end product design cycle (and its difficulties)
User testing skills and methods
Confidence in converting feedback into productive changes
What I learnt
Collaborating with graphic designers to create beautiful, intuitive interfaces
Focus more on creating an aesthetic appearance (if I had more time)
Include more functions and variables
What I would have done differently
Andrew Xing
UI/UX Designer based in Sydney
Copyright © 2024 Andrew Xing. All rights reserved.